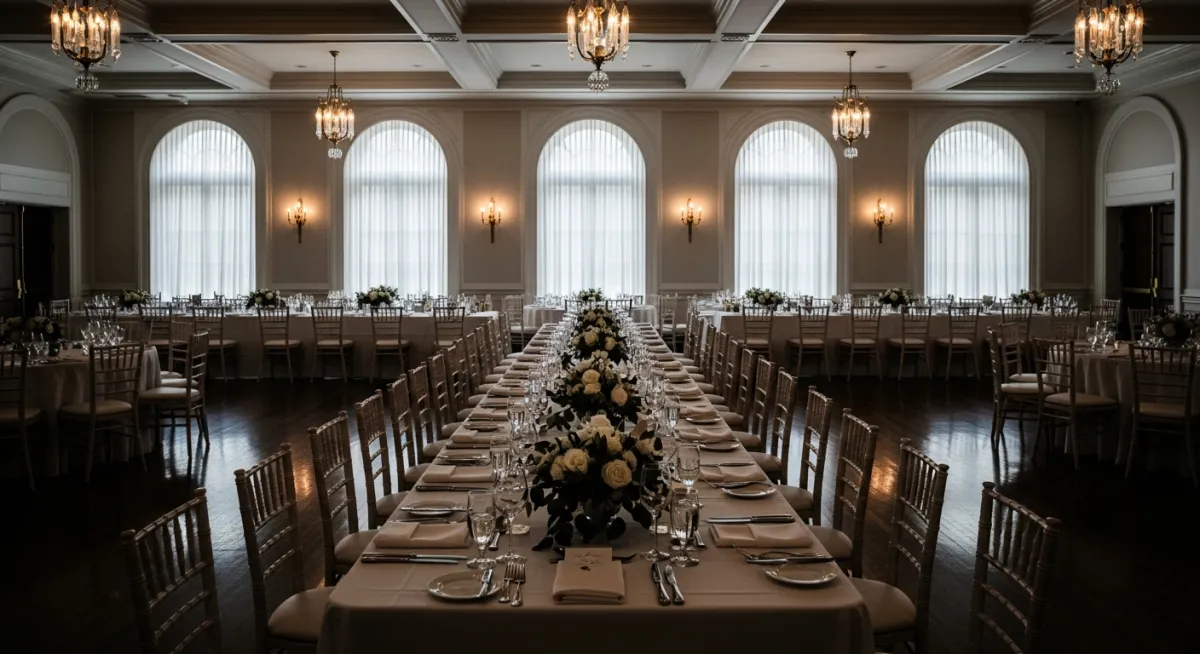
What Empty Venue Dates Actually Cost You
If you run an independent event venue — a loft, a ballroom, a garden estate, a renovated warehouse — you already know the sting of an empty Saturday night. But most venue owners never sit down and calculate exactly what those blank squares on the calendar actually cost.
It is not just the lost booking fee. It is the mortgage or lease payment that still hits. The insurance premium. The landscaping crew. The lights you left on for a tour that never converted. When you add it all up, every empty prime date could be costing you $1,500 to $3,000 in overhead alone — before you even count the revenue you did not earn.
That number is not abstract. It is the gap between running a venue that barely breaks even and one that clears $10,000 a month. And once you see it clearly, every decision you make about pricing, follow-up, and marketing becomes sharper.
The Revenue Calculator: What One Empty Saturday Really Costs
Most venue owners look at an empty date and see one lost rental fee. The real number is significantly higher. Here is a worked example with a venue that charges $3,000 per Saturday and has 10 available Saturdays in peak season, booking 7 of them.
On the surface, the 3 empty Saturdays look like $9,000 in lost revenue. But the real cost calculation has four components:
- Lost rental revenue: $9,000. Three Saturdays at $3,000 each. This is the number most owners stop at — but it is only the beginning.
- Carrying costs during empty periods: $2,400. Your fixed overhead — utilities, insurance, maintenance — does not pause for empty dates. Allocating $800 per month across those 3 empty Saturdays (a conservative estimate for a venue spending $4,000-$8,000/month on overhead) adds $2,400 to the real cost. Your insurance company does not care whether you hosted 10 events this month or zero.
- Missed off-peak fill opportunities: $5,400. Those 3 dates could have been filled at an off-peak rate of $1,800 — if you had a deliberate off-peak pricing strategy and were actively marketing to corporate clients, brand photographers, or nonprofit events for those windows. At $1,800 per fill, that is $5,400 in revenue that a proactive strategy would have captured.
- Lost referral chain: $1,440. Every event you host has a referral multiplier. Research suggests a 40 percent referral rate for satisfied venue clients — meaning 4 out of every 10 bookings generates at least one additional booking. Each referral booking is worth $3,000. Three empty Saturdays at a 40 percent referral rate times 1.2 average referrals per referring client equals $3,000 × 0.4 × 1.2 × 3 = $4,320 in missed referral revenue, or $1,440 per empty Saturday.
Total real cost: $9,000 + $2,400 + $5,400 + $1,440 = $18,240 for 3 empty Saturdays. That is $6,080 per empty date — more than twice the visible rental fee.
The 4-Step Worksheet to Calculate Your Own Number
- Add up your fixed monthly costs. Rent or mortgage, insurance, utilities, any staff on salary, landscaping, cleaning, and maintenance. For most independent venues doing under $15,000 a month in revenue, this lands between $4,000 and $10,000. Pull your last three bank statements and average the total outflow not tied to a specific event.
- Count your bookable prime dates this month. For most venues, this means weekends and Friday evenings — roughly 8 to 12 dates per month. Divide your monthly overhead by those bookable dates to get your carrying cost per date. If overhead is $6,000 and you have 10 bookable dates, each empty date costs you $600 just to keep the doors open.
- Add your average rental fee to the carrying cost per date. If your average booking is $2,500 and your carrying cost per date is $600, the true opportunity cost of one empty Saturday is $3,100 — not $2,500. Write that number on a sticky note and put it where you see it every morning.
- Multiply by your empty dates last month. If four Saturdays sat empty at $3,100 real cost each, that is $12,400. Over a quarter: $37,200. Over a year: $148,800. That is the number you are managing against. Going from 50 percent to 75 percent fill rate on prime dates is not just a nice improvement — it is the difference between breaking even and clearing $10,000 a month consistently.
A Real-World Example
A small wedding venue outside Austin had 12 bookable Saturdays per quarter and was filling 5 of them. Fixed costs ran about $7,500 a month, and the average booking brought in $2,200. She was losing roughly $16,000 per quarter in empty-date costs.
Once she mapped this out, she realized that adding just two more bookings per month would move her from losing money to clearing $4,400 in profit monthly. She started by listing on Peerspace for weekday brand shoots and optimizing her Google Business Profile. Within 60 days, she picked up three additional bookings per month — two weekend weddings from improved follow-up speed and one weekday shoot from Peerspace. Her quarterly revenue jumped by $19,800, and her empty-date cost dropped by more than half.
Where the Money Actually Goes
When you break down empty-date costs, the biggest categories for most independent venues are rent or mortgage at 30 to 40 percent of fixed costs, insurance at 10 to 15 percent, and utilities combined with maintenance at 20 to 25 percent. The remaining portion covers landscaping, cleaning between events, and any part-time staff on regular schedules.
Understanding this breakdown helps you see where small operational changes reduce your per-empty-date cost. Switching to motion-activated lighting, renegotiating your insurance annually, or shifting landscaping to biweekly during slow months can shave $200 to $500 off monthly fixed costs. That does not solve the revenue problem, but it lowers the floor and gives you more margin on the dates you do fill.
Once you know your real cost per empty date, every strategy in venue marketing has a clear dollar value attached to it. The pricing page guide walks through how to use tiered pricing to fill off-peak dates at a lower rate rather than leaving them empty at zero.
Frequently Asked Questions
How do I calculate the real carrying cost per empty date?
Add all fixed monthly costs — rent, insurance, utilities, maintenance, and any staff on regular salary or retainer. Divide that total by the number of bookable prime dates in the month (typically 8 to 12 for venues focused on weekends and Friday evenings). The result is your overhead cost per date. For a venue with $6,000 in monthly overhead and 10 bookable Saturdays, each empty Saturday absorbs $600 in fixed costs regardless of revenue. Add that to your average rental fee to see the full opportunity cost of each empty date.
Is it worth lowering my rates to fill empty dates?
Yes, in most cases — but use a separate pricing tier rather than discounting your standard rate. An off-peak weekday rate, a last-minute availability discount, or a special rate for non-profit events all fill the date without training clients to expect discounts on your peak inventory. A date filled at $1,800 is better than an empty date that costs you $600 in carrying costs and $0 in revenue. The key is that the off-peak rate should be clearly differentiated from your prime rate — promoted as a different tier, not a sale.
What is a realistic occupancy rate for a venue in its first 2 years?
Most independent venues achieve 40 to 55 percent occupancy on prime dates in year one and 55 to 70 percent by year two with active marketing and a functional follow-up system. Venues without a dedicated listing strategy, a Google Business Profile, or a structured inquiry follow-up process often land closer to 30 percent in year one. The 30 percent to 60 percent jump typically comes from fixing the same two things: faster lead response (under 5 minutes versus same-day) and a direct booking path on the website. A 70 percent-plus occupancy rate in year two indicates strong market fit and is a signal to consider raising prices.
At what occupancy percentage does a venue become profitable?
It depends on your fixed cost structure and average booking rate, but a general rule is that venues with fixed costs under $6,000 per month typically break even at 50 to 60 percent occupancy on prime dates, and become meaningfully profitable at 70 percent or above. Venues with higher fixed costs — $8,000 to $12,000 per month — often need 65 to 75 percent occupancy to cover costs and clear a real salary. The fastest path to profitability is not always filling more dates — it can also be reducing overhead (switching to event-based staffing rather than salaries) or increasing average booking value through add-ons and tiered pricing.
Have an event venue? List your venue for free on the OMG Rentals Directory and start reaching clients who are actively searching for spaces like yours.
